POCs and VAHs VALs - All and Non-BrokenThe "POC and VAH VAL - All and Non-Broken"
POC = Points of Control
VAH = Value Area High
VAL = Value Area Low
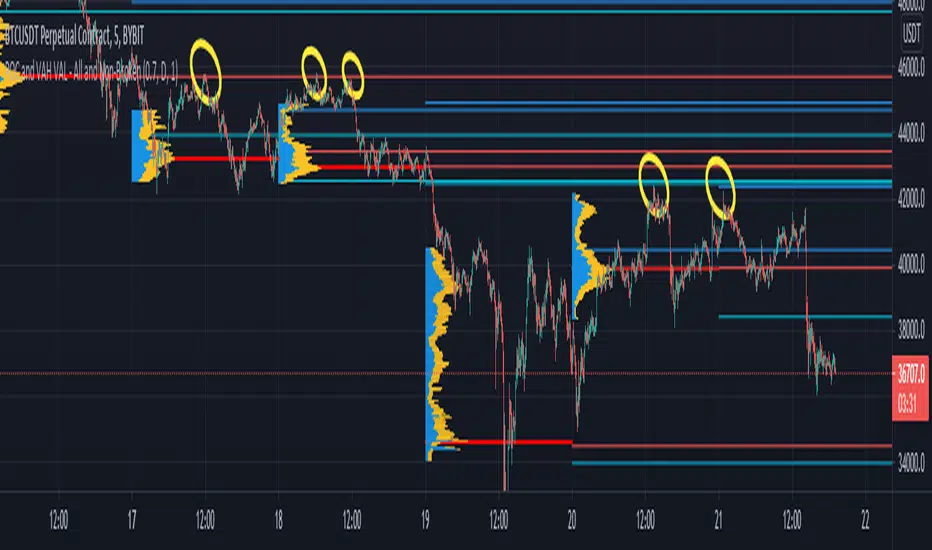
This indicator aims to show you on the 5 minute time frame all POCs and VAHs/VALs and Non-Broken POCs and VAHs/VALs.
(Non-Broken are POCS and VAHs/VALS where price action has not since crossed its path)
In the screen image above I have used VPVR to back test on BYBIT:BTCUSDT.
The POCs and VAHs/VALs for each day can be seen.
Also there is an option to see non-broken POCS and VAHs/VALs within the settings.
All display options are selectable within the settings.
The indicator is not as precise as using the VPVR but is a lot quicker and gives you a quick snapshot to assist with your technical analysis.
In the screen shot above are some examples highlighted with yellow circles (resistance at POC and VAHs/VALs).
Thanks goes to:
ahancock for use of his code.
Bjorn Mistiaen on StackOverFlow for his assistance.
Disclaimer:
Indicator has been coded to only show on 5 min time frame (after back testing seemed most accurate).
Only back tested on BYBIT:BTCUST.
There are some slight discrepancies.
Back tested against VPVR settings: Row Size 500, Value Area 70.
Maximum of 500 lines will only be shown.
在腳本中搜尋"point of control"
Hancock - POC VAThis indicator shows POC (Point of Control) and VA (Value Area) High and Low as well as the developing ranges. This indicator makes use of the new arrays which means the resolution for calculating POC and VA is up to 100k bins at, in most cases, tick resolution and allows for custom time-frames.
Not much else needs to be said about this indicator.
Happy Trading
Hancock

Baseline-C [ID: AC-P]The "AC-P" version of jiehonglim's NNFX Baseline script is my personal customized version of the NNFX Baseline concept as part of the NNFX Algorithm stack/structure for 1D Trend Trading for Forex. Everget's JMA implementation is used for the baseline smoothing method, with optional ATR bands at 1.0x and 1.5x from the baseline.
NNFX = No Nonsense Forex
Baseline = Component of the NNFX Algorithm that consists of a single moving average
Baseline ---> Meant to be used in conjunction with ATR/C1/C2/Vol Indicator/Exit Indicator as per NNFX Algorithm setup/structure. C1 is 1st Confirmation Indicator, C2 is 2nd Confirmation Indicator.
JMA (Jurik Moving Average) is used for the baseline and slow baseline.
A slow baseline option is included, but disabled by default.
The faint orange/purple lines are 1.0x/1.5x ATR from the Baseline, and are what I use as potential TP/SL targets or to evaluate when to stay out of a trade (chop/missed entry/exit/other/ATR breach), depending on the trade setup (in conjunction with C1/C2/Vol Indicator/Exit Indicator)
This script is heavily based upon jiehonglim's NNFX Baseline script for signaling, barcoloring, and ATR.
SSL Channel option included but disabled by default (Erwinbeckers SSL component)
POC (Point of Control) from Volume Profile is included/enabled by default for both the current timeframe and 12HR timeframe
03.freeman's InfoPanel Divergence Indicator was used a reference to replace the current/previous ATR information infopanel/info draw from jiehonglim's script. I'm not sure whether I like the previous way ATR info was displayed vs how I have it currently, but it's something that is completely optional:
Specifically: I am tuning this baseline/indicator for 1D trading as part of the NNFX system, for Forex.
DO NOT USE THIS INDICATOR WITHOUT PROPER TUNING/ADJUSTMENT for your timeframe and asset class.
Note about lack of alerts:
Alerts for baseline crosses (and other crosses) have been purposefully omitted for this version upon initial publication. While getting alerts for baseline crosses under certain conditions/filtered conditions that eliminate low-importance signals and crossover whipsaw would be great, it's something I'm still looking into.
SPECIFICALLY: There are entry, exit, take profit, and continuation signal components in relation to the Baseline to the rest of the NNFX Algorithm stack (ATR/C1/C2/Vol Indicator/Exit Indicator), including but limited to the "1 candle rule" and the "7 candle rule" as per NNFX.
Implementing alerts that are significant that also factor in these rules while reducing alert spam/false signals would be ideal, but it's also the HTF/Daily chart - visually, entry/exit/continuation signal alignment is easy to spot when trading 1D - alerts may be redundant/a pursuit in diminishing returns (for now).
//-------------------------------------------------------------------
// Acknowledgements/Reference:
// jiehonglim, NNFX Baseline Script - Moving Averages
//
// Fractured, Many Moving Averages
//
// everget, Jurik Moving Average/JMA
//
// 03.freeman, InfoPanel Divergence Indicator
//
// Ggqmna Volume stops
//
// Libertus RSI Divs
//
// ChrisMoody, CM_Price-Action-Bars-Price Patterns That Work
//
// Erwinbeckers SSL Channel
//

PheeTrades - Value Area Levels (VAH / VAL / POC Visualizer)This script helps traders quickly visualize key Volume Profile–style levels such as Value Area High (VAH), Value Area Low (VAL), and Point of Control (POC) using recent price and volume data.
While TradingView’s built-in Volume Profile tool is great for manual analysis, this indicator automatically calculates and plots approximate value zones directly on your chart — ideal for traders who want to identify high-probability support and resistance areas without drawing a fixed range every time.
Features:
Calculates short-term VAH, VAL, and POC based on a user-defined lookback period.
Plots color-coded levels for quick visual reference.
Helps identify “fair value” zones where most trading activity occurred.
Useful for detecting breakout or mean-reversion opportunities around value extremes.
How to use:
Apply the script to any chart and set your preferred lookback period.
VAH (red line): potential upper resistance or overbought zone.
VAL (green line): potential lower support or accumulation zone.
POC (orange line): price level with the highest traded activity — often a magnet for price.
Note:
This is a simplified Value Area model meant for educational and analytical use. It does not replace TradingView’s official Volume Profile or broker-level volume distribution data.

Smooth Cloud + ZigZag VPOC CORE v6📌 Description
The Smooth Cloud + ZigZag VPOC indicator is designed to help traders visualize market structure and potential confluence zones.
Smooth Cloud: Built from smoothed moving averages (EMA, RMA, or HMA), this cloud highlights the underlying short-term trend by shading bullish and bearish phases.
Pivots (ZigZag style): Marks confirmed swing highs and lows, helping to identify support/resistance and breakout areas without repainting.
VPOC (Volume Point of Control): Plots the price level with the highest traded volume, either from a rolling lookback or anchored to a custom date. This often acts as a magnet or reaction level.
ATR Bands: Optional dynamic bands based on volatility to frame potential extension zones.
Signals & Alerts: Generates long/short labels when price breaks pivot levels in line with trend filters, with optional confluence from HTF trend, VPOC, and ATR.
This tool combines trend context, structure, and volume confluence in a single view to support decision-making.
✅ Notes
This script is intended for technical analysis and educational use only.
It does not provide financial advice or guaranteed outcomes.
Signals are purely analytical and should be combined with independent risk management.

Phantom Trend IndicatorOverview
The Phantom Trend Indicator (PTI) is a streamlined tool for identifying trend direction and strength. It blends zigzag-based trend detection with a volume profile to display a histogram showing price distance from the Point of Control (POC). Six distinct colors highlight trend states, with background highlights for extreme price zones. Ideal for stocks, forex, crypto, and futures across any timeframe.
Features:
Trend Detection: Uses zigzag fractals to identify uptrends and downtrends.
Histogram Colors: Six colors for trend strength (low, high, extreme for up/down trends) or neutral (gray).
Dynamic Levels: Plots POC, Value Area Low (VAL), and High (VAH) via volume profile.
Background Colors: Highlights overbought (above VAH) or oversold (below VAL) zones.
Alerts: Signals new trends.
How It Works:
Trends: Zigzag fractals define trend ranges, with price position setting histogram colors (low, high, or extreme).
Histogram: Shows price deviation from POC.
Background: Colors extreme zones outside VAL/VAH.
This indicator builds on traditional trend detectors and volume profiles by integrating them into a single, cohesive tool. Unlike standard momentum indicators that rely on moving averages, PTI uses zigzag fractals for more responsive trend identification, reducing lag in volatile markets. Compared to basic volume profile scripts, it adds trend-based color coding and background alerts for extremes, providing clearer visual cues for overbought/oversold conditions. The six distinct colors indicate trend strength, and customizable thresholds allow fine-tuning for different assets and timeframes, enhancing adaptability. Traders benefit from combined momentum and liquidity insights, helping spot reversals or continuations more reliably—making PTI a valuable, standalone addition for both novice and experienced users.
Settings
Trend Detector: Toggle alerts, adjust zigzag sensitivity, and set thresholds for low-to-high and extreme color transitions.
Dynamic Levels: Configure volume profile period, multiplier, accuracy, value area percent, and ATR-based channel width.
Visuals: Customize POC, VAL, VAH, and area fill colors.
Read Histogram: Uptrend colors show early, strong, or overextended moves; downtrend colors indicate early, weakening, or oversold conditions; gray for consolidation.
Background: Monitor for overbought/oversold color-coded signals.
Tune: Adjust zigzag or period settings for your timeframe/asset.
Tips
Shorten period for intraday, extend for swing trading.
Pair with other indicators for confirmation.
Notes:
Requires sufficient chart data for volume profile.
Test settings for low-volatility assets.
For informational use only, not financial advice. Test thoroughly, and happy trading!

Simple TPODisplays price distribution over time using Time Price Opportunities (TPO). Shows Point of Control (POC), Value Area High/Low (VAH/VAL) levels to identify key support/resistance zones and fair value areas. Includes customizable timeframes and price breakout alerts.

Prev Day Volume ProfileWhat the script does
Calculates yesterday’s Volume Profile from the bars on your chart (not tick data) and derives:
POC (Point of Control)
VAL (Value Area Low)
VAH (Value Area High)
Draws three horizontal lines for today:
POC in orange
VAL and VAH in purple
Adds labels on the right edge that show the level name and the exact price (e.g., POC 1.2345).
Why it’s bar-based (not tick-based)
Pine Script can’t fetch external tick/aggTrades data. The script approximates a volume profile by distributing each bar’s volume across the price bins that the bar’s high–low range covers. For “yesterday”, this produces a stable, TV-native approximation that’s usually sufficient for intraday trading.
Key inputs
Value Area %: Defaults to 0.70 (70%)—the typical value area range.
TZ Offset vs Exchange (hours): Shifts the day boundary to match your desired session (e.g., Europe/Berlin: +1 winter / +2 summer). This ensures “yesterday” means 00:00–24:00 in your target timezone.
Row Size: Manual? / Manual Row Size: If enabled, you can set the price bin size yourself. Otherwise, the script chooses a TV-like step from syminfo.mintick.
Colors & Line width: POC orange; VAL/VAH purple; configurable width.

Modified Point of ControlThis script finds the candle with the highest volume per an adjustable lookback. It can be used to help determine support and resistance.

open_is_low(VOL)Like market profile VPOC, the Virgin Open_is_Low (VOL) is a Point of Control below which price has not closed in past.
Once price closes below VOL the indicator would not paint further.
This indicator will act as Support and Resistance.

open_is_high(VOH)
Like market profile VPOC, the Virgin Open_is_High (VOH) is a Point of Control above which price has not closed in past.
Once price closes above VOH the indicator would not paint further.
This indicator will act as Support and Resistance.

open_is_high(VOH)
Like market profile VPOC, the Virgin Open_is_High (VPOC) is a Point of Control above which price has not closed in past.
Once price closes above VOH the indicator would not paint further.
This indicator will act as Support and Resistance.
